Molar Absorptivity of PMoB and [H+] Diagrams
The [H+] diagrams, obtained by plotting acidity, against slope of calibration line, reveal that the maximum slope is reached at a suitable combinations of [H+] normality with concentration of molybdate [Mo]. Strikingly, yet not surprisingly, maximized slope of calibration line is the same over the entire range of [H+] and [Mo] concentrations presented in [H+] diagrams, and is independent on the type of acid used in this study.
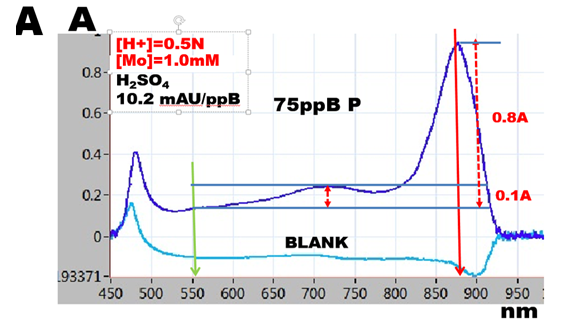
The value of the maximized slope, averaged to 10.5 mAU/ppB P, was measured using 20cm long optical path, in solutions of phosphate standards diluted with reagents in ratio 1 + 1. This yields for a.w. P=31 the molar absorptivity ε = 3.3x10exp4 measured at 880nm with reference at 550nm.
The spectrum of reactants (A) at optimized conditions exhibits single, well defined maximum, with a shoulder showing an elevation at 720nm. Spectrum in absence of phosphate (BLANK), is flat above 550nm wavelength.
Note that all spectra obtained at optimized [H+]&[Mo] concentrations show the same features (HC5, S5, S6, N3, N4). Surprisingly, the range of optimized acidities is rather narrow. Thus e.g. for hydrochloric acid (1.5.11. Fig.A.) for [Mo]=1.0 mM the optimized range is 0.2N to 0.4 N HCl. Thus, while it is generally accepted that PMoB assay is best carried out at pH 0 to 1, "this statement although true, is misleading, as it does not imply limitation due to necessity of using suitable [H+]&[Mo] combination of concentrations.
With increasing acidity reaction rate of formation of PMoB decreases as seen on decreasing slope of reaction rate curves (S1, HC1, N1). Spectra of reactants confirm this, because the absorbance at 880nm maximum is similar at optimized acidities, (S5, S6, HC4, HC5, N4, N5), while at higher acidities absorbance at 880nm decreases (S7, HC6, N6)
With decreasing acidity initially a small peak appears at 880nm on spectrum of BLANK, (S4, HC4) displacing absorbance of PMoB higher (S4,S3, HC3). As acidity decreases, more of MoB is produced, the resulting colloidal suspension scatters light, and increasingly obscures spectrum of PMoB (S2, HC2, N2) (1.5.14. Fig.A)
It follows that the range of suitable acidities is limited by two processes; decrease of formation of PMoB, and increase in formation of reagent blank (MoB). Also it is important to note that [H+] diagrams presented here, are valid for incubation time of 30 seconds and use of molybdate reagent containing antimony, which accelerates reaction rate of formation PMoB.